UL Solutions Inc. Reports Strong Third Quarter 2024 Results
November 6, 2024
UL Solutions Inc. has recently reported results for their third quarter which ended September 30, 2024.
“This is our third quarterly report since becoming a public company and I’m very pleased that our results extended our momentum from the first half of 2024, with all segments and regions contributing positively,” said President and CEO Jennifer Scanlon. “We achieved 9.3% organic revenue growth, Adjusted EBITDA margin expansion and continued to generate substantial cash flow as we served our customers in more than 110 countries. Certification testing in Industrial and Consumer segments showed particular strength reflecting megatrends and contributions from recent lab investments.”
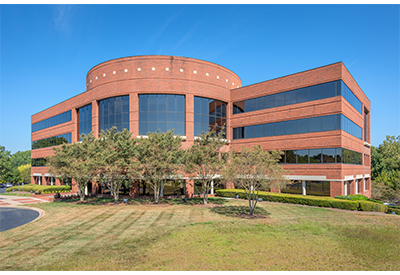
Scanlon added that strategic investments to meet growing customer demand in line with global megatrends were exemplified by the Company’s largest lab investment to date – the industrial and EV battery testing facility in Auburn Hills, Michigan.
“This state-of-the-art, 90,000-square-foot facility opened in August with tremendous commercial interest. We also plan to construct a new Advanced Automotive and Battery Testing Center in Pyeongtaek, Gyeonggi-do, Korea, expanding current UL Solutions battery testing capacity in the region,” Scanlon said. “Our investment-grade balance sheet, resilient business model, and strong cash flow profile enable us to expand our capabilities and offerings in important growth sectors, while maintaining a balanced approach to capital allocation.”
Chief Financial Officer Ryan Robinson added, “Our strategy of targeting high-growth sectors in the product TIC industry is yielding positive results. Strong market tailwinds are driving demand for our services, contributing to another quarter of robust performance. Given our strong year-to-date performance, we’re strengthening our full-year financial outlook and are on pace to complete our first year as a public company on strong footing.”
Third Quarter 2024 Financial Results
Revenue of $731 million compared to $676 million in the third quarter of 2023, an increase of 8.1%. Organic growth of 9.3% across all segments, led by Industrial and Consumer segments.
Net income of $94 million compared to $57 million in the third quarter of 2023, an increase of 64.9%. Net income margin of 12.9% compared to 8.4% in the third quarter of 2023, an increase of 450 basis points.
Adjusted Net Income of $104 million compared to $98 million in the third quarter of 2023, an increase of 6.1%. Adjusted Net Income margin of 14.2% compared to 14.5% in the third quarter of 2023, as revenue gains were offset by higher compensation costs and interest expense.
Adjusted EBITDA of $183 million compared to $163 million in the third quarter of 2023, an increase of 12.3%. Adjusted EBITDA margin of 25.0% compared to 24.1% in the third quarter of 2023, an increase of 90 basis points. The margin expansion resulted from higher revenue and expense management, led by the Consumer segment.
| 1 This press release includes references to non-GAAP financial measures. Please refer to “Non-GAAP Financial Measures” later in this release for the definitions of each non-GAAP financial measures presented, as well as reconciliations of these measures to their most directly comparable GAAP measures. |
Third Quarter 2024 Segment Performance
Industrial Segment Results
Industrial revenue of $317 million compared to $290 million in the third quarter of 2023, an increase of 9.3%, or 11.7% on an organic basis. Operating income of $90 million compared to $87 million in the third quarter of 2023. Operating income margin of 28.4% compared to 30.0% in the third quarter of 2023. Adjusted EBITDA of $106 million compared to $96 million in the third quarter of 2023, an increase of 10.4%.
Adjusted EBITDA margin of 33.4% compared to 33.1% in the third quarter of 2023. Revenue and Adjusted EBITDA gains were driven by value-based pricing initiatives, continued demand related to electrical products, renewable energy and component certification testing, as well as increased laboratory capacity. Margin improvement was driven by both higher revenue and higher operational efficiency.
Consumer Segment Results
Consumer revenue of $321 million compared to $295 million in the third quarter of 2023, an increase of 8.8%, or 9.2% on an organic basis. Operating income of $37 million compared to operating loss of $5 million in the third quarter of 2023. Operating income margin of 11.5% compared to operating loss margin of 1.7% in the third quarter of 2023. Adjusted EBITDA of $62 million compared to $50 million in the third quarter of 2023, an increase of 24.0%. Adjusted EBITDA margin of 19.3% compared to 16.9% in the third quarter of 2023. Revenue and Adjusted EBITDA gains were driven by retail and electromagnetic compatibility testing. Margin improvement was driven by both higher revenue and higher operational efficiency.
Software and Advisory Segment Results
Software and Advisory revenue of $93 million compared to $91 million in the third quarter of 2023, an increase of 2.2% on a total and organic basis. Operating income of $3 million compared to $7 million in the third quarter of 2023. Operating income margin of 3.2% compared to 7.7% in the third quarter of 2023. Adjusted EBITDA of $15 million compared to $17 million in the third quarter of 2023, a decrease of 11.8%. Adjusted EBITDA margin of 16.1% compared to 18.7% in the third quarter of 2023. Revenue gains were driven by increased software revenue. The change in margin was primarily driven by higher compensation expenses associated with company-wide performance-based incentives.
Liquidity and Capital Resources
For the first nine months of 2024, the Company generated $394 million of net cash provided by operating activities, an increase from $341 million for the same period in 2023. Net cash provided by operating activities for the first nine months of 2024 was impacted by lower payments related to the Company’s cash-settled stock appreciation rights.
The Company continues to make strategic capital investments in energy transition opportunities to meet increased demand, and capital expenditures were $179 million, an increase from $156 million for the same period in 2023. Free Cash Flow for the first nine months was $215 million, compared to $185 million through the third quarter of 2023.
The Company paid a dividend of $25 million during the three months ended September 30, 2024.
As of September 30, 2024, total debt was $802 million, prior to unamortized debt issuance costs, a decrease from December 31, 2023 due to $110 million of net repayments on the Company’s revolving credit facility.
The Company ended the quarter with cash and cash-equivalents of $327 million compared to $315 million at December 31, 2023.
In September 2024, the Company completed a follow-on public offering of an aggregate of 23,000,000 shares of Class A common stock consisting entirely of secondary shares sold by the selling stockholder. The Company did not sell any shares in the offering and did not receive any proceeds from the sale of the shares.
Full-Year 2024 Outlook
The Company’s key points on 2024 outlook include:
- Increasing to mid-to-high single digit constant currency, organic revenue growth
- Q4 constant currency, organic revenue growth expected to be in the mid-to-high single digit range
- Reiterating full-year Adjusted EBITDA margin improvement
- Capital expenditures expected to be 8.0 to 8.5% of revenue
- Continuing to pursue acquisitions and portfolio refinements
The Company’s 2024 outlook is based on a number of assumptions that are subject to change and many of which are outside the control of the Company. If actual results vary from these assumptions, the Company’s expectations may change. There can be no assurance that the Company will achieve the results expressed by this outlook.

https://www.ul.com/news/ul-solutions-inc-reports-strong-third-quarter-2024-results

